Edmonton Solar Case Study:
$220/Month Bill Reduced to Near Zero
A south Edmonton homeowner installs an 8.4 kW system. We walk through the actual electricity bills, production data, and 25-year financial model.
The Home and the Bill
This homeowner lives in a 2,200 sq ft two-storey in south Edmonton, built in 2004. Prior to solar, the home consumed approximately 14,400 kWh per year. On EPCOR's regulated rate option, monthly bills ranged from $120 in summer to $280 in winter, averaging around $220 per month.
The roof features a large south-facing slope with a 4:12 pitch, minimal shading from surrounding trees, and good southwest exposure. These conditions made it an excellent candidate for a rooftop array.
System Specifications
| System size | 8.4 kW DC |
| Panel count | 21 x 400W panels |
| Inverter | SolarEdge string inverter with optimizers |
| Annual production | ~10,700 kWh/yr |
| Roof orientation | South-facing, 4:12 pitch |
| Utility | EPCOR (Edmonton) |
| Net billing | 12-month credit rollover |
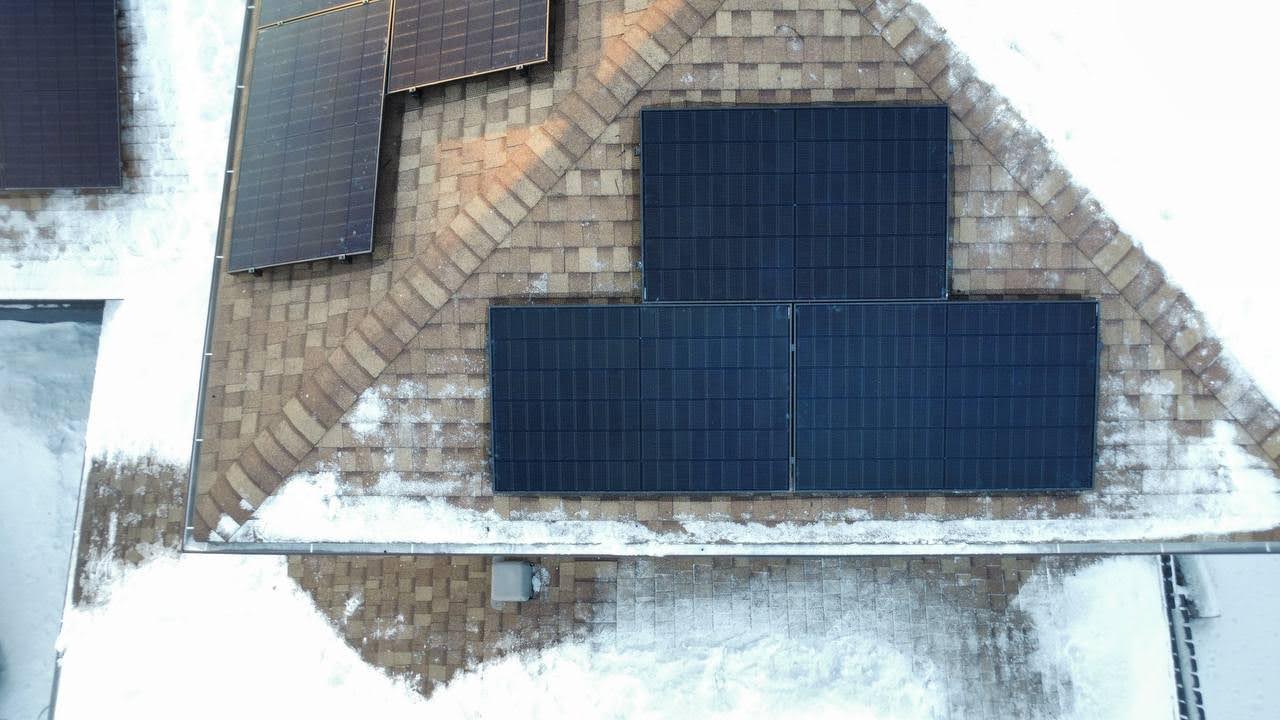
Installation on the south-facing roof slope. 21 panels mounted at optimal angle.
Before the Bill
Here's a representative summer bill from this home before installation. Note the breakdown of charges: energy, distribution, transmission, local access fee, and admin charges.
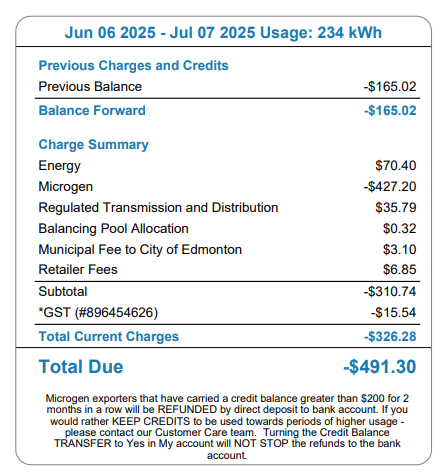
Pre-solar Edmonton electricity bill. Total charges: $187 for a summer month with 1,040 kWh consumption.
Solar Production vs. Home Consumption
Once the system was activated, EPCOR's bidirectional meter began tracking both consumption and export. The production graph below shows the seasonal pattern: peak production in June and July, with significant drops in November through January.
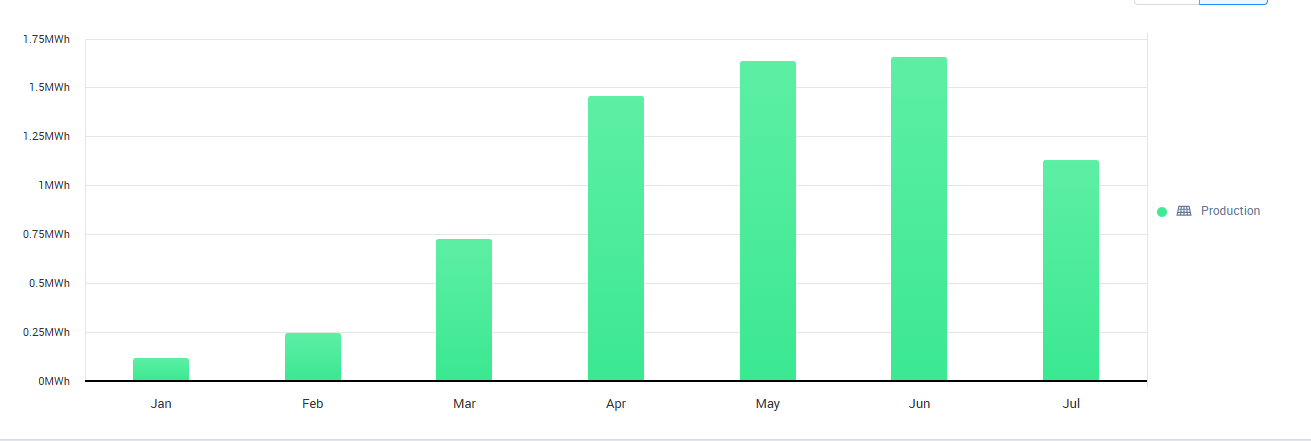
Monthly solar production (blue) vs. home consumption (orange). Summer surplus builds up the net billing credit bank.
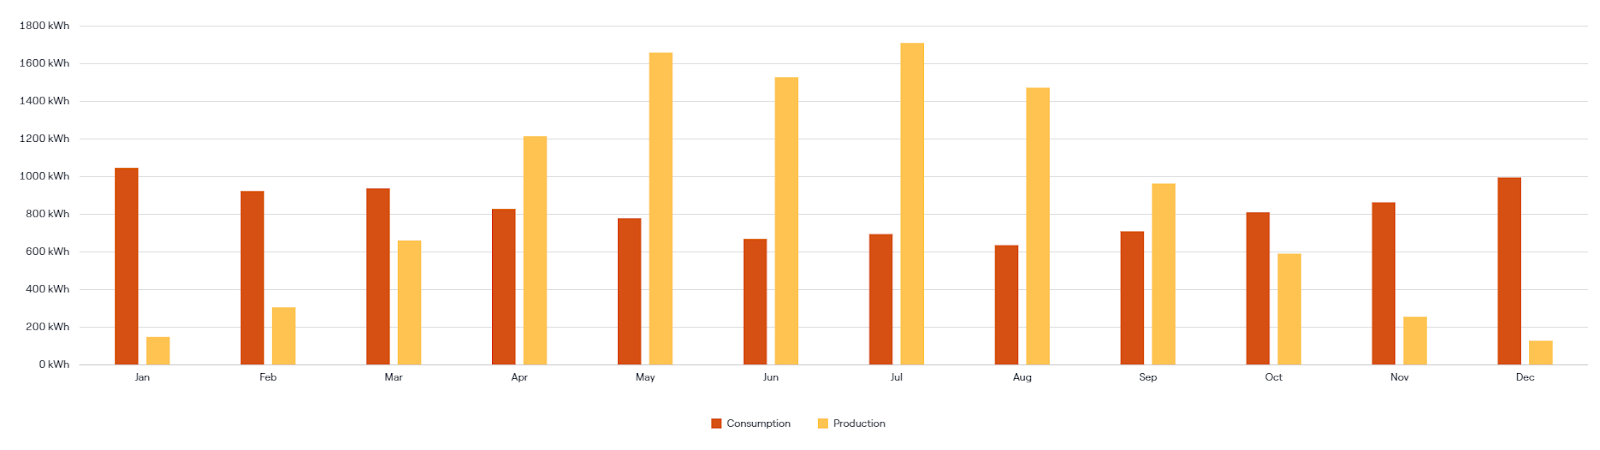
Grid draw vs. solar production over 12 months. Net billing credits from May to September carry the home through the low-production winter months.
The Break-Even Point
At current EPCOR rates with a 2.5% annual electricity escalation assumption, this home breaks even on the solar investment at approximately year 12. After that, all electricity savings are pure return.
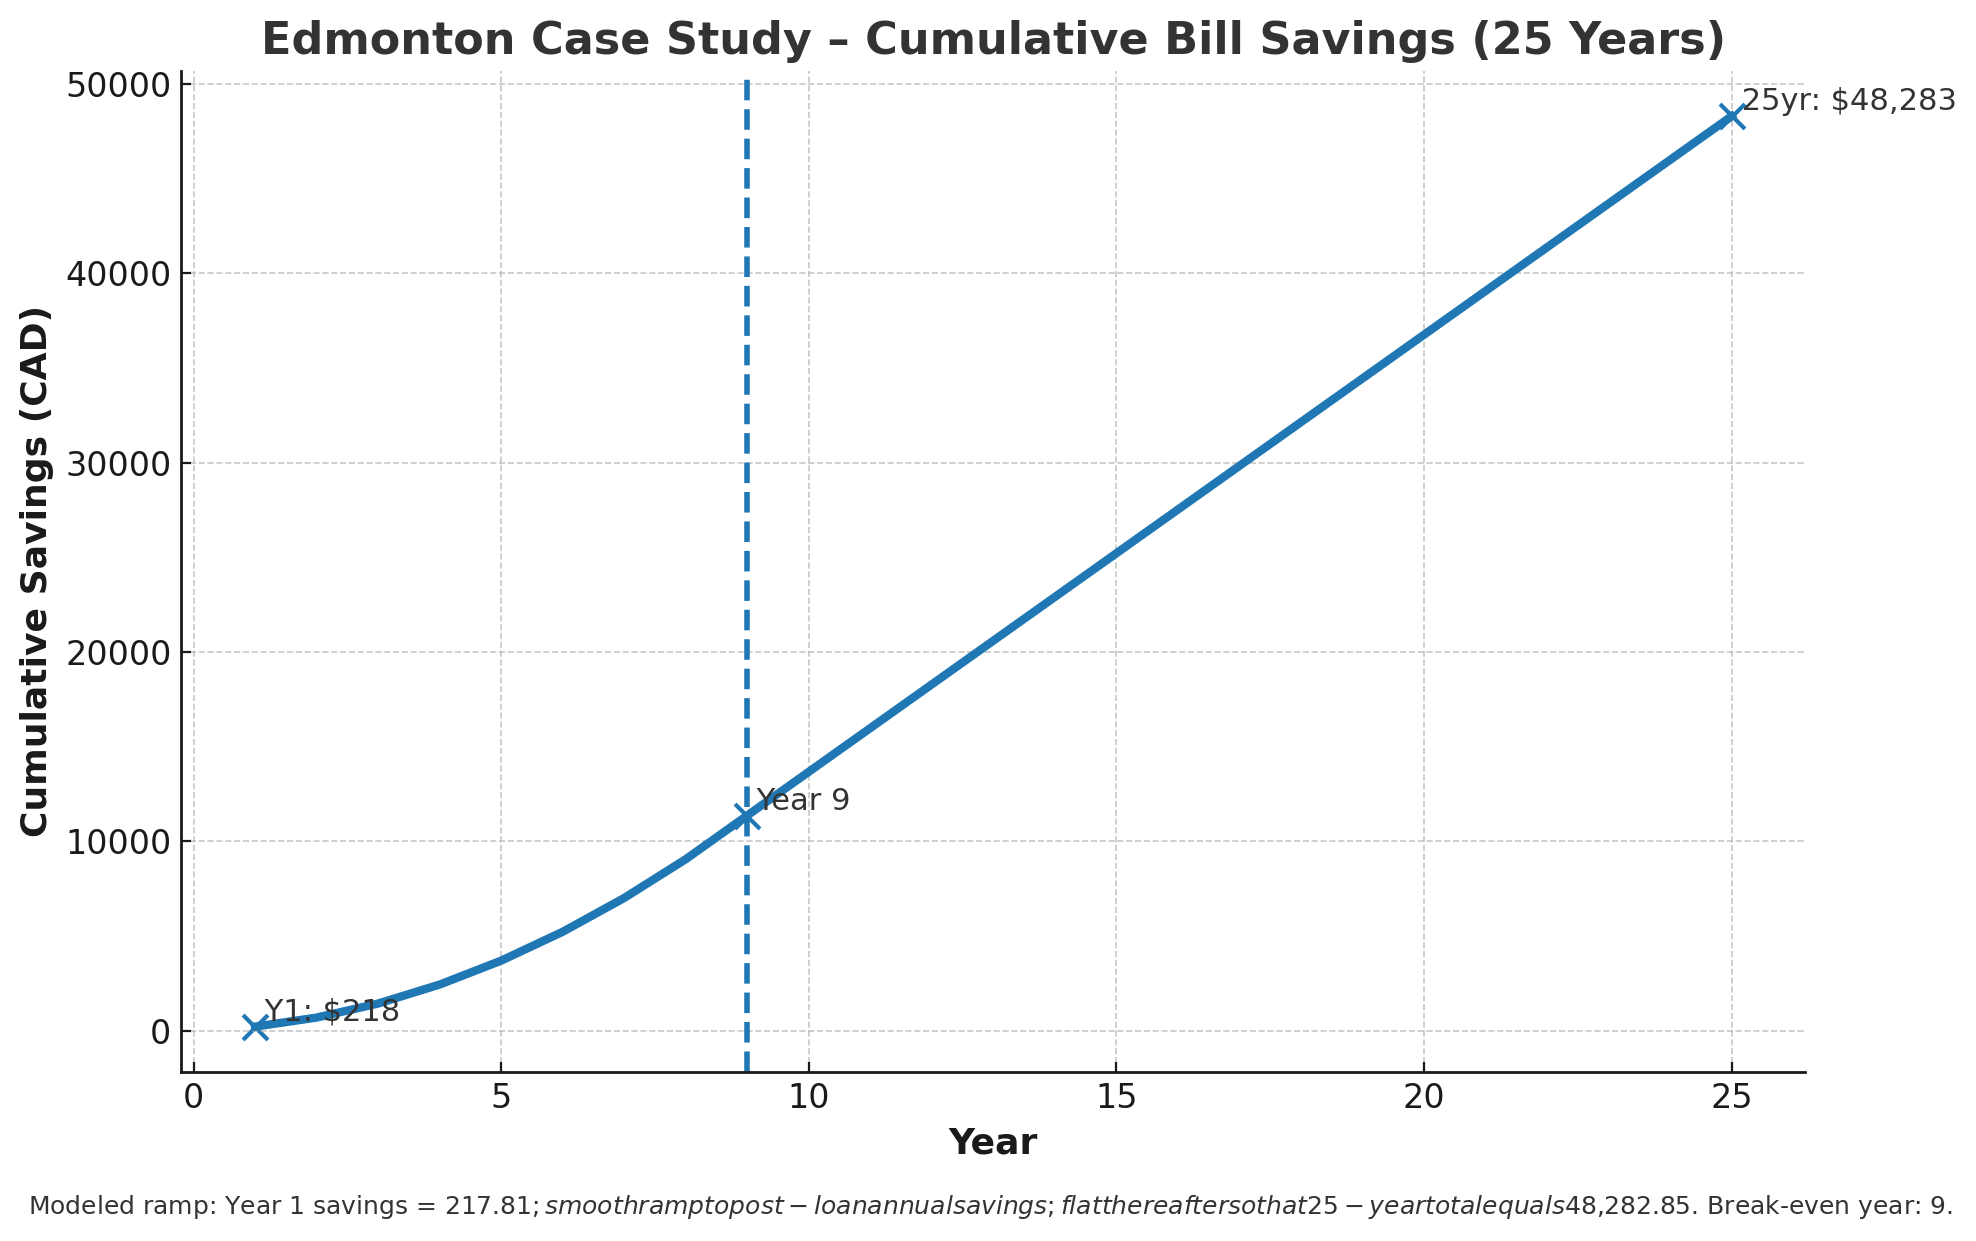
Cumulative savings curve. The system crosses the break-even line around year 12 and generates approximately $45,000 in lifetime savings over 25 years.
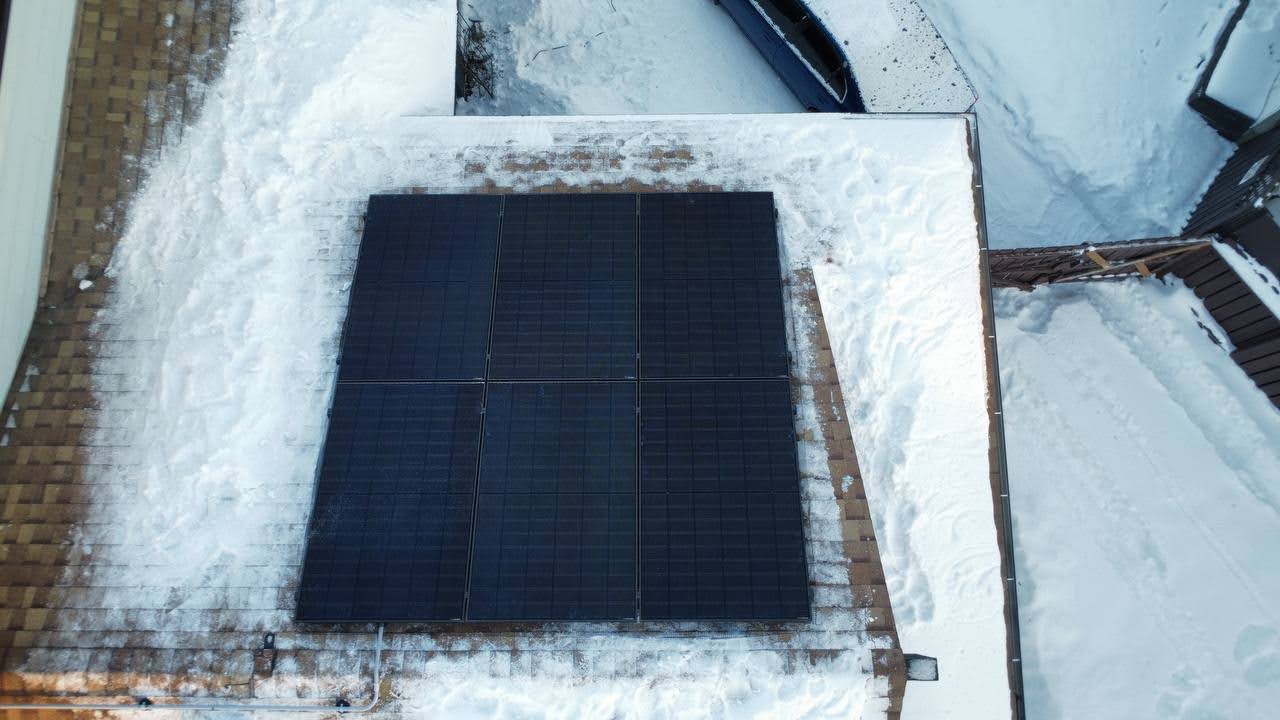
Completed installation. The array is sized to maximize south-facing exposure while leaving clearance at roof edges per permit requirements.
What This Homeowner's Bill Looks Like Now
After the first full year of operation, this homeowner's total electricity cost dropped from approximately $2,640 per year to around $480. The remaining charges are the fixed components of the bill (admin fees, minimum charges) that don't disappear regardless of solar production.
In the high-production months from May through September, the home often shows a $0 net charge with credits banking forward. November through January still draws on the grid, but the accumulated credit bank covers most of those costs.
See More Edmonton Area Case Studies
Browse other Alberta solar case studies to see how savings vary by home size, location, and financing method. For Airdrie homeowners who used CEIP financing, see the Airdrie case study. For a larger acreage installation near Edmonton, see the Beaumont case study.
If you're an Edmonton homeowner, visit our Edmonton solar page for information specific to EPCOR interconnection, Edmonton permits, and CEIP status for the city.
Get a Proposal Modeled on Your Actual Bill
We pull your roof data, your utility rate, and your consumption to build a proposal that reflects what solar actually does for your home, not an average.